Serbia reports
Economic Indicators (GDP, Unemployment Rate, Inflation Rate) – Serbia
Although pre-coronavirus data showcased a strengthening economy at the outset of 2020, the scenario has dramatically shifted due to the pandemic. The outlook for this year has deteriorated notably since February. According to latest World Bank report, gross domestic product of Serbia will decrease by 2.5% this year, which is lower than 3-6.5% decline for the rest of West Balkan counties. Serbian authorities expects below 2.0% contraction for the 2020 year.
Gross Domestic Product
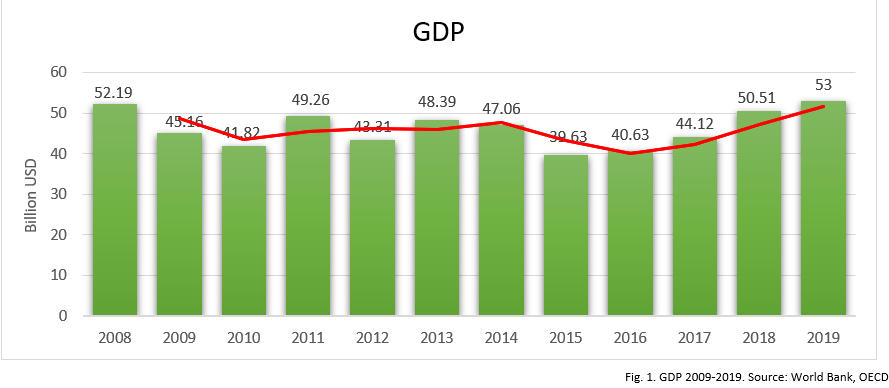
After decrease in 2008 due to financial crisis, and excluding 2013, where unprecedented floods occurred, Serbia GDP is on constant growth path, accelerating in recent years. The major growth drivers for the past decade are foreign company investments in automotive sector (Fiat) and steel production (HBIS) coupled with increased construction activity. Comparing to basis level in 2008, ending level of dollar in terms of local currency dinar is doubled, which adversely affected GDP figures in 2015-17 when dollar was on historical high values vis-a-vis dinar, illustrated on graph below.
However, Serbian economy is highly dependent on trade activity with European countries, so one of National Bank of Serbia top priorities is keeping EUR/RSD currency pair stable. After depreciation in 2008-12 period due to expansive fiscal policy and accumulation of national debt, for most of the past decade dinar is hovering around 120 spot rate with almost non-existent volatility on daily level.
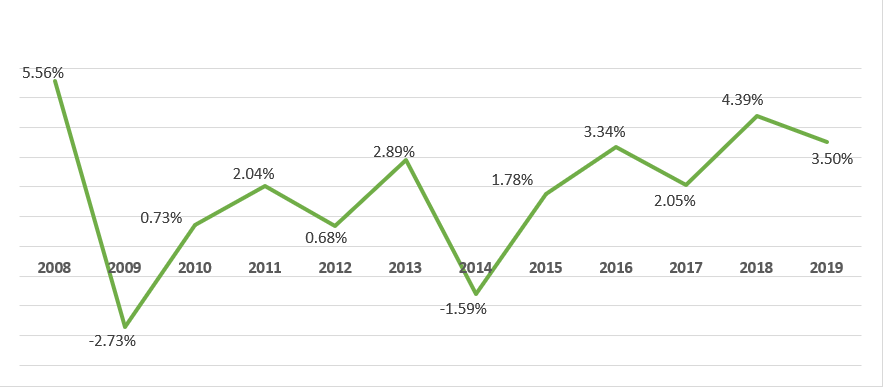
As mentioned above, floods in 2013-14 particularly negatively affected electricity and agriculture production levels, which are one of the main contributors in Serbia GDP. Other than this year, economic activity in Serbia is on uptrend movement.
Unemployment Rate
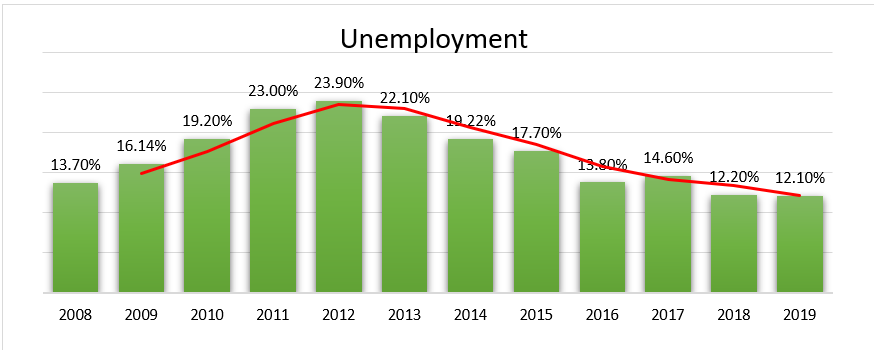
Financial market crisis reflected on Serbia with certain delay and lasted almost 2 years longer. After reaching peak in 2012 election year with almost ¼ unemployed working force, unemployment rate is halved to 12%. Reasons backing up this positive trend is development of IT industry in Serbia and increased number of public projects related to highway/building construction. However methodology is biased towards presenting lower than actual rate of unemployment.
Inflation Rate
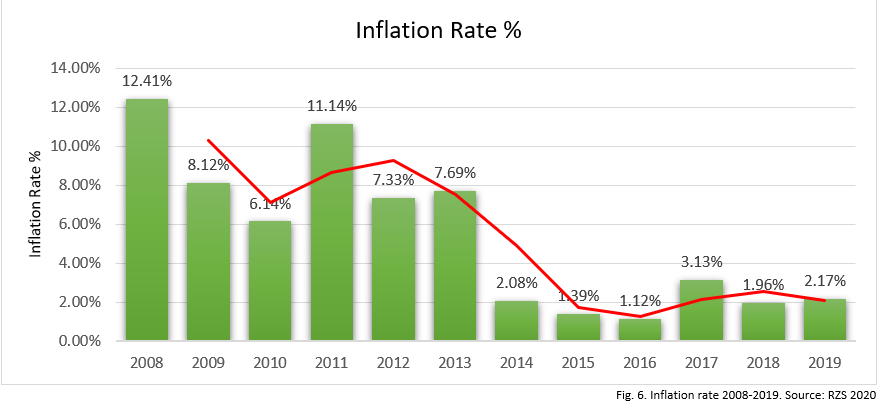
From the starting double digits values in start of 2010, mostly influenced by growing amount of debt and volatility on EUR/RSD currency pair, National Bank of Serbia managed to put inflation in strategic 3±1.5% corridor after 2014. In most recent periods, like other European economies, Serbia is also facing almost zero-interest environment which is reflecting on low inflation readings, currently below 2% Y-o-Y basis.
Real estate Market in Serbia
Property Sales in Serbia by Type 2019
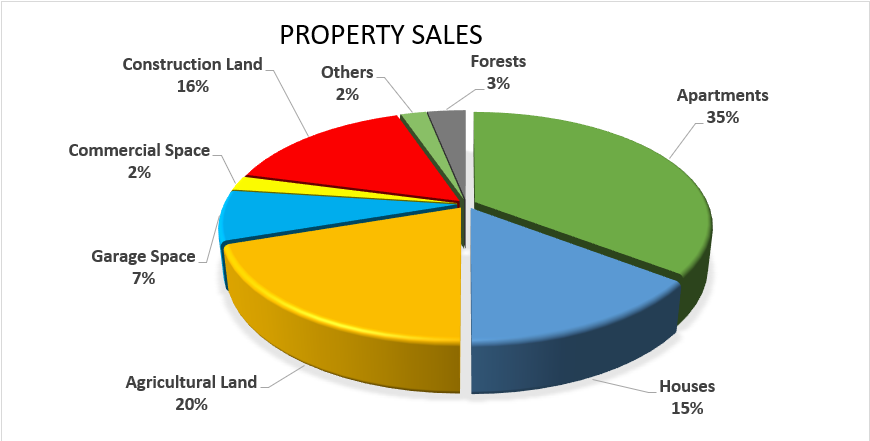
Apartments experienced an increase of 1% compared to the previous year and continue to have the largest market share of 35%. Demand amongst sub-categories is stable across the years, with half of the sales coming from residential units. Also, 46% of total transaction values related to real estate market is derived from apartments segment.
New Residential Construction
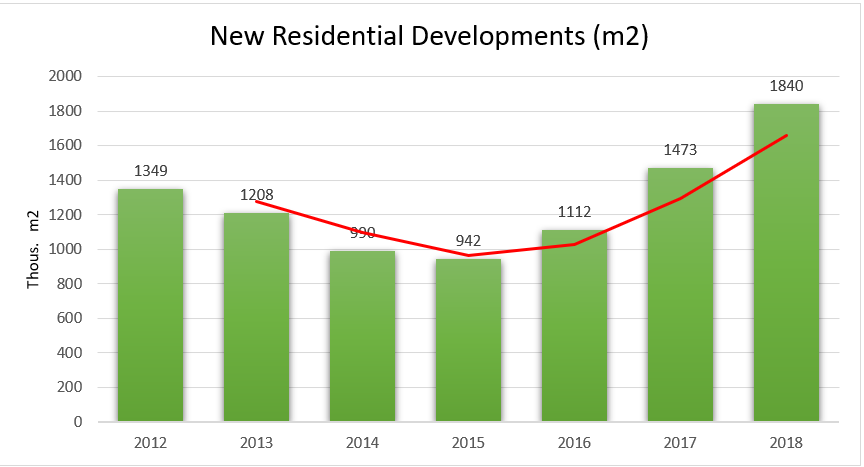
After contraction registered in mid of decade, set of simplified and quicker application process for acquiring construction permission measures initialized uptrend movement in this sector. In latest published data for 2018, new residential developments increased by more than 20%, similar growth is expecting for 2019.
Total Value and Number of Sales
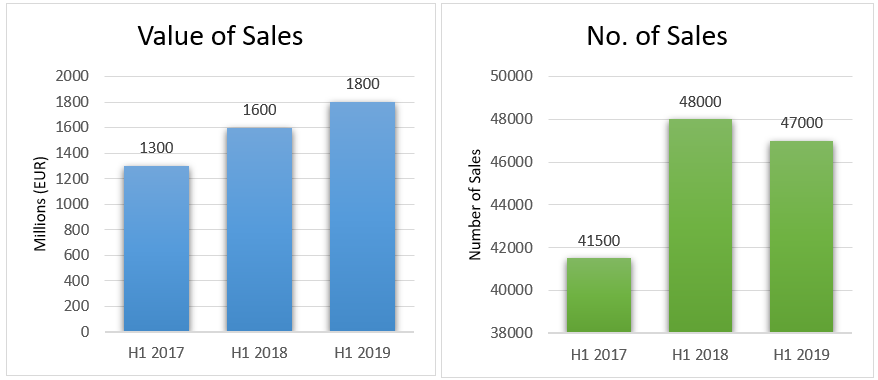
Supported by positive trends in economic activity, low interest rate environment, increasing demand from foreign citizens for real estate investment in Serbia, value of sales related to this segment is on double digit growth. Another factor which contribute to sustainable growth in this sector is limited supply and long term demographic trends of population moving to industrial centers (Belgrade and Novi Sad). Despite number of sales slightly decrease in 2019, increase in average price of transaction was more than enough to preserve growth in value of properties sold.
Property Purchases (Cash vs Credit)
Although condition for mortgage payments are currently favorable, cash transactions are still dominant in Serbia. Comparing to more developed markets, share of mortgage purchase are still low, accounting just 20%. For instance, according to PWC study, turnover in 2018 for Italian residential units was financed 50.7% from mortgages.
Residential Market in Belgrade
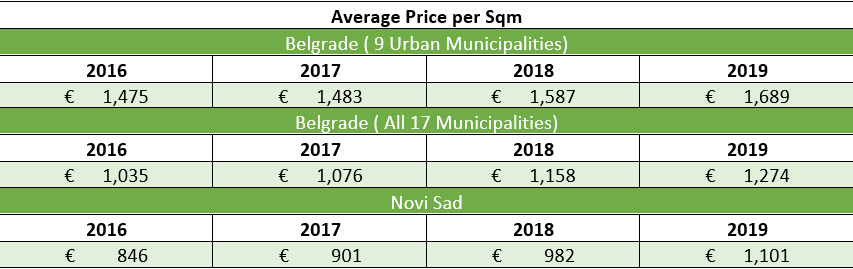
Belgrade real estate market recorded in 2019 residential properties sales worth €995 million or 19.88% more than in H1 2018. Development of IT industry in Serbia, alongside with increasing demand from Serbian diaspora and foreign citizens keeps pushing price forward. Another contribution in sharp price increase is coming from launch of Belgrade Waterfront project, which offering residential units in exclusive part of Belgrade. Another IT center, Novi Sad also experiencing constant increase in price per m2, but price in the other cities of Serbia is stable or even decreasing.
Average Price Growth
Average Price by Location
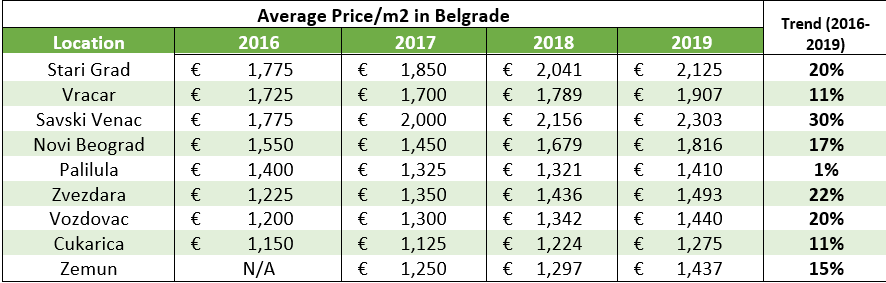
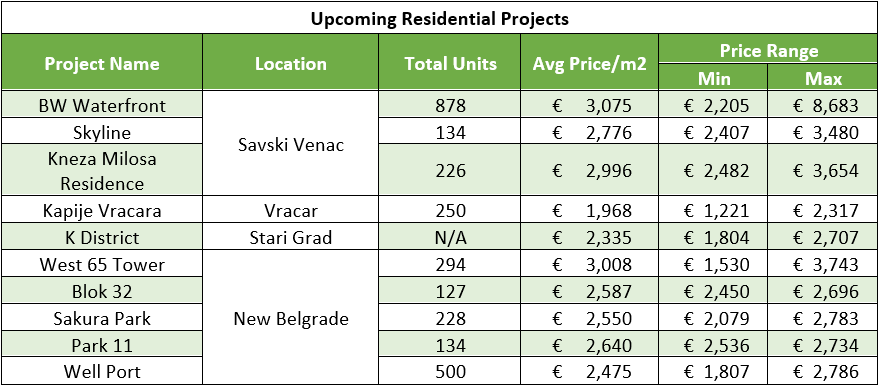
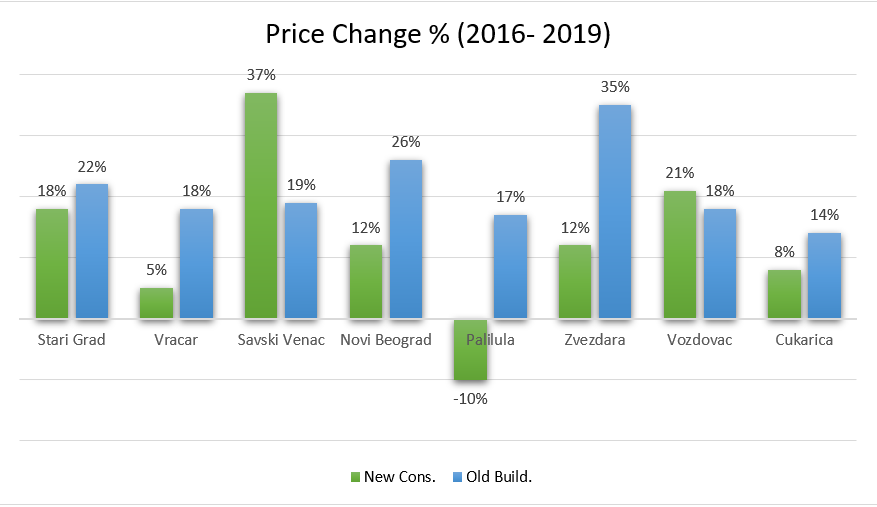
Beside Belgrade Waterfront, few other luxury development projects are also taking place in Savski Venac, which resulted in highest growth rates for average price. Despite having most prestigious locations in Belgrade, Stari Grad and Vracar due to configuration of soil and presence of state protected buildings have less potential for new construction buildings, and hence more moderate growth of average price per m2.
Price Change in Percentage (2016-2019)
Average Apartment Size in БЕЛГРАД
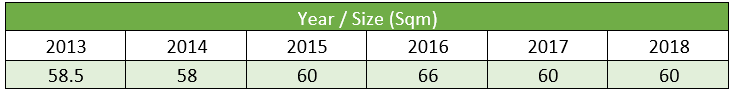
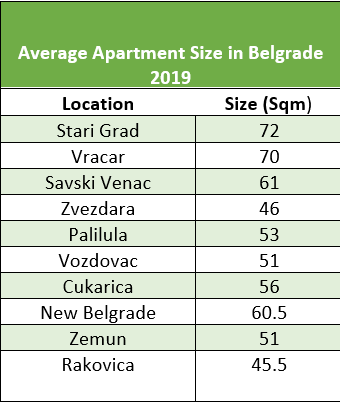
Average apartment size can be categorized in 2 groups. In first group, city core Stari Grad and Vracar area is smaller comparing to other regions and has more share of buildings constructed before World War II when the average apartment size was more than 100m2 in vast majority. Other segments consists of post-World War II projects (especially New Belgrade), when the average apartment size was much smaller. Also, due to commercial needs, most of newly launched residential constructions has target size of apartment around 60m2.
Highest Price per Apartment (Old Buildings/New Developments)
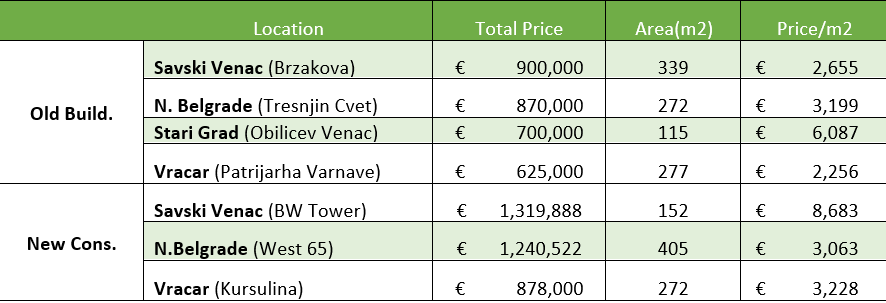
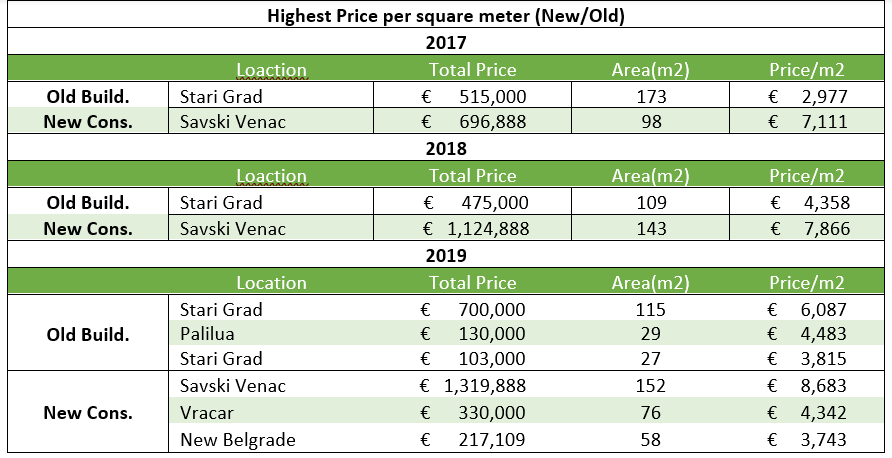
Highest Price per Square Meter (Old Buildings/New Developments)
Notable Larger Scale Projects Under Construction